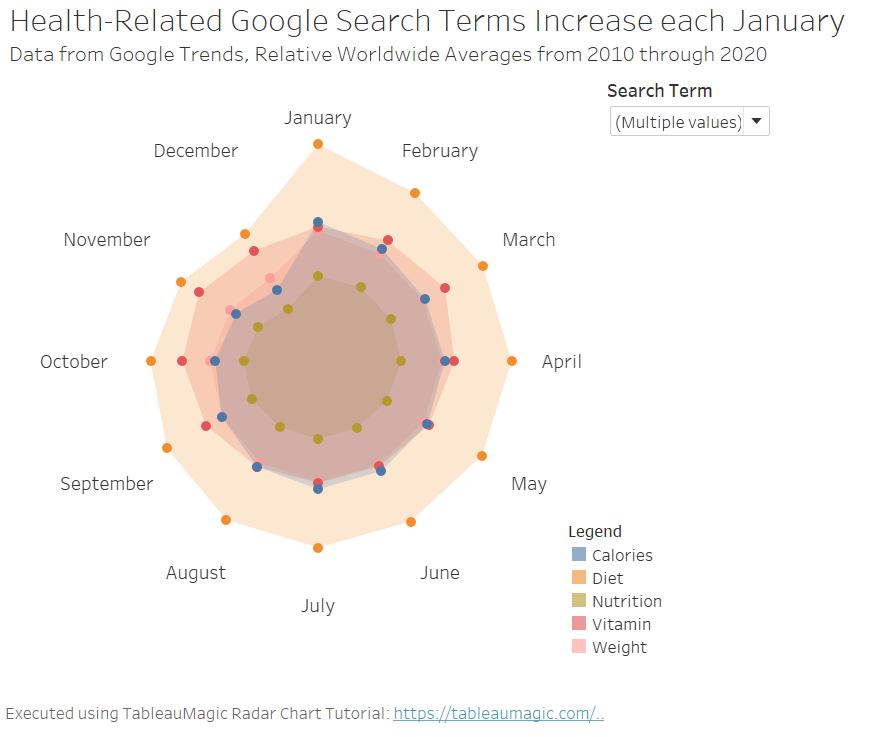
Google Trends has a wealth of global search term data from 2004 to the present day. I have an interest in nutrition, health, and cooking, so for this visualization I started looking for trends in this cluster of terms. When I noticed some of the periodic surges I thought it would be a good opportunity to practice a radar (radial) chart. Historically I haven’t found these graphs particularly useful – the ones I’ve been asked to create had different attributes on each arm. However, I recalled a Data Viz Today episode referring to a time-based radial chart by Nadieh Bremer and Zan Armstrong and thought it might have a similar application here.
Author: Jill Brown
Website: https://jill-brown.com/portfolio/health-serch-periodicity/
Interactive Viz: https://public.tableau.com/profile/jill.brown3861#!/vizhome/PeriodicityofSearchTerms/Dashboard1?publish=yes


